Report
 }
}
Written in collaboration with
Written in collaboration with

Executive summary
This is the 14th consecutive year Bain & Company and Worldpanel have tracked the shopping behaviors of Chinese consumers. Our continuing research provides a valuable long-term perspective across fastmoving consumer goods (FMCG) categories purchased for home consumption in China.
For context, FMCG only covers categories that are considered daily necessities and that households buy on a daily or weekly basis. Other consumption categories, such as apparel, appliances, travel, and restaurant, are not included in FMCG.
In 2024, we updated the categories of FMCGs we track to align more closely with evolving market dynamics. We now track and analyze trends for 27 FMCG categories across four sectors: packaged food, beverage, personal care, and home care.
This report recaps FMCG performance in 2024, updating our findings in China Shopper Report 2024, Vol. 2. It also includes Worldpanel shopper behavior data for 2024 and the first quarter of 2025.
Brands and retailers can use this report to explore emerging shopping trends and position their organizations for success.
Reflections on 2024
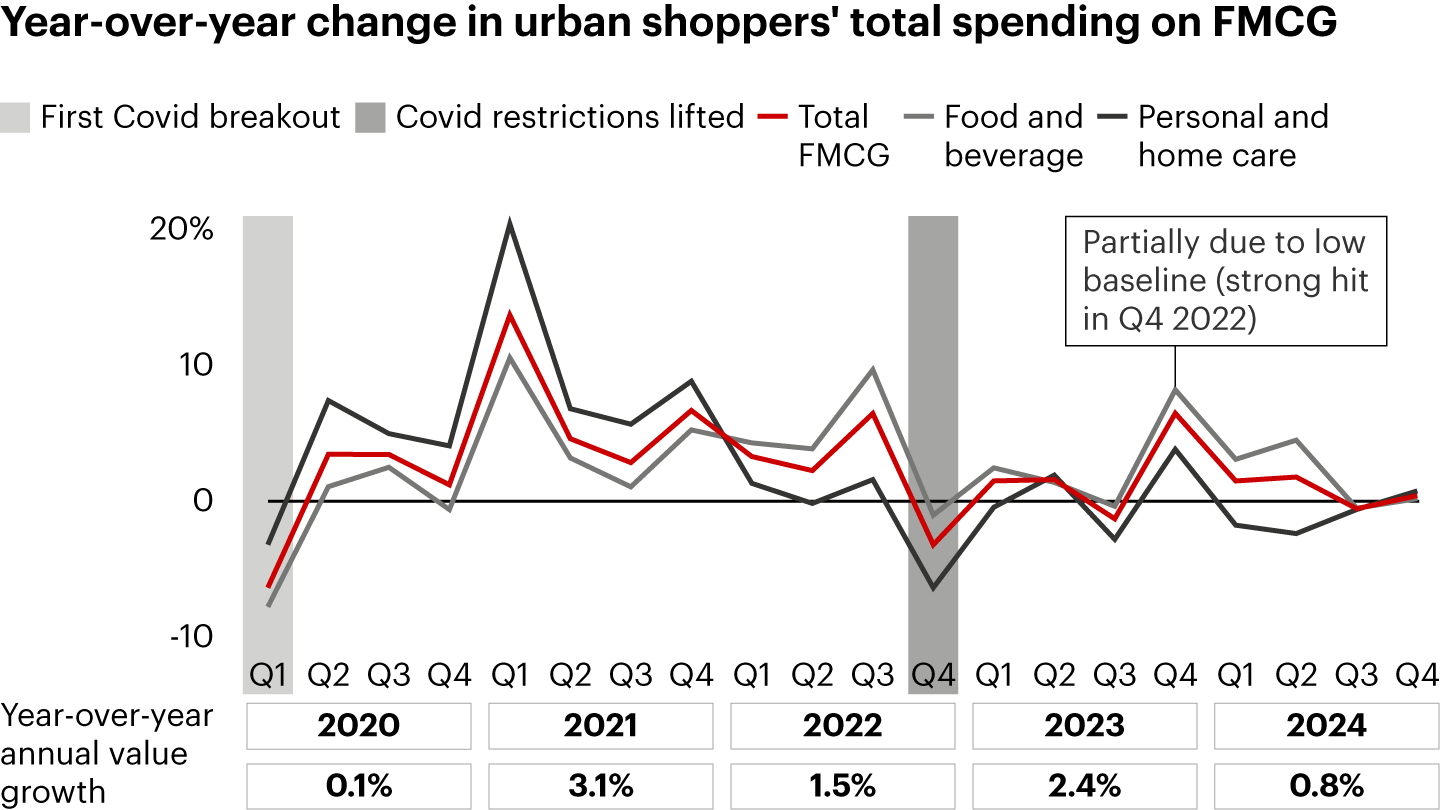
2024 was a challenging year for China’s FMCG market. Annual spending growth was nearly flat at 0.8%—the lowest in the past four years—and no quarter exceeded 2.0% growth (see Figure 1). Macroeconomic conditions were less than favorable, with the Consumer Price Index increasing only 0.2% in 2024. The Consumer Confidence Index was 86.4 at the end of 2024, after fluctuating from 85 to 90 throughout the year.

Note: Worldpanel updated the consumer universe, leading to some inconsistencies with previous years’ data
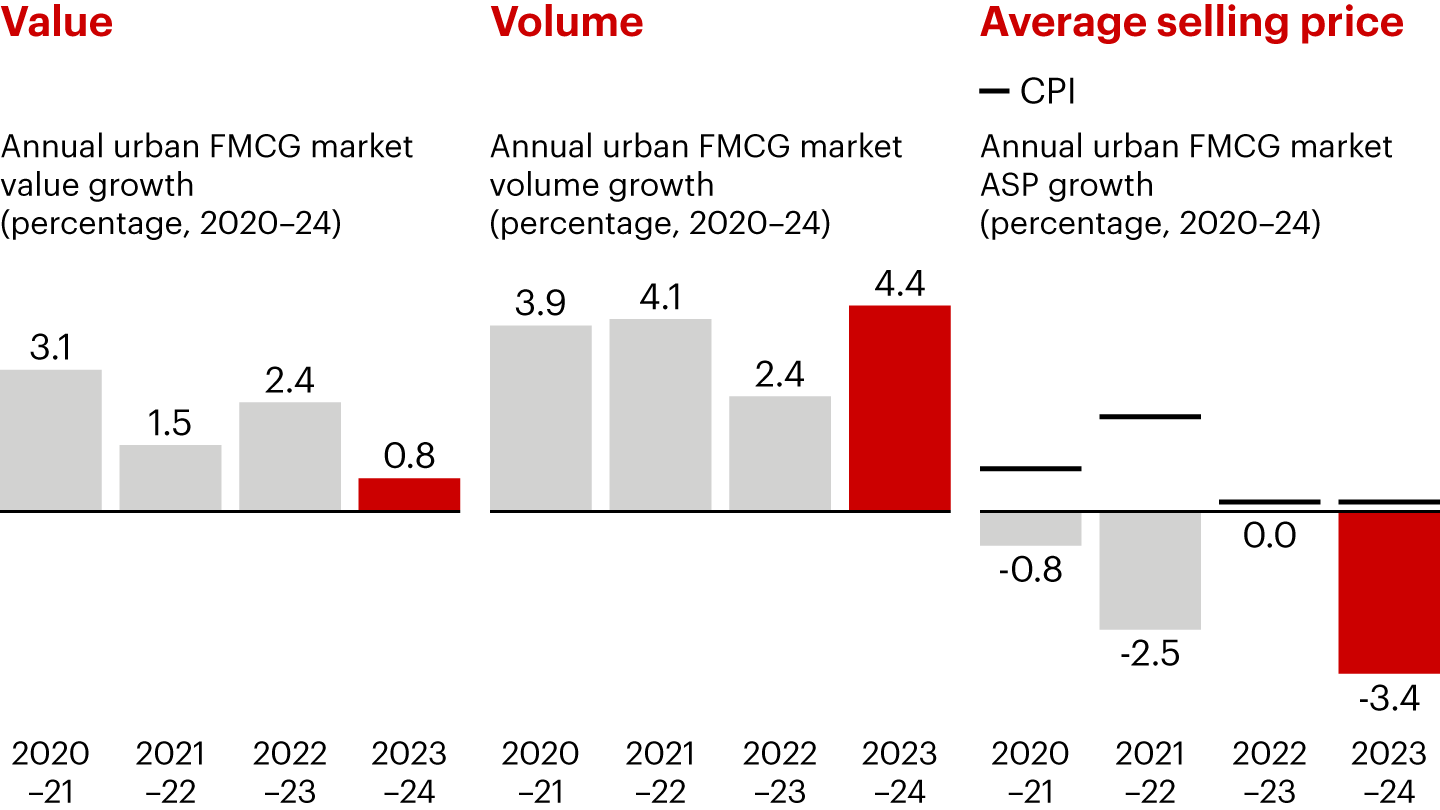
Sources: Worldpanel; Bain analysisDespite flat market performance overall, volume growth was strong at +4.4%. However, volume growth was offset by a major decline (-3.4%) in average selling prices (ASP), which suggests a significant downward pricing trend. The lower ASP was mostly driven by downtrading or intense promotional activities.
Looking at quarterly performance, value growth reached +1.5% and +1.8% in Q1 and Q2, respectively, then declined to -0.6% in Q3 before slightly rebounding to +0.4% in Q4.
From 2020 to 2024, value growth was positive for FMCGs overall despite annual fluctuations in volume growth. The decline in ASP was notable in 2024; it dropped to -3.4%—the biggest ASP drop over the past four years (see Figure 2).

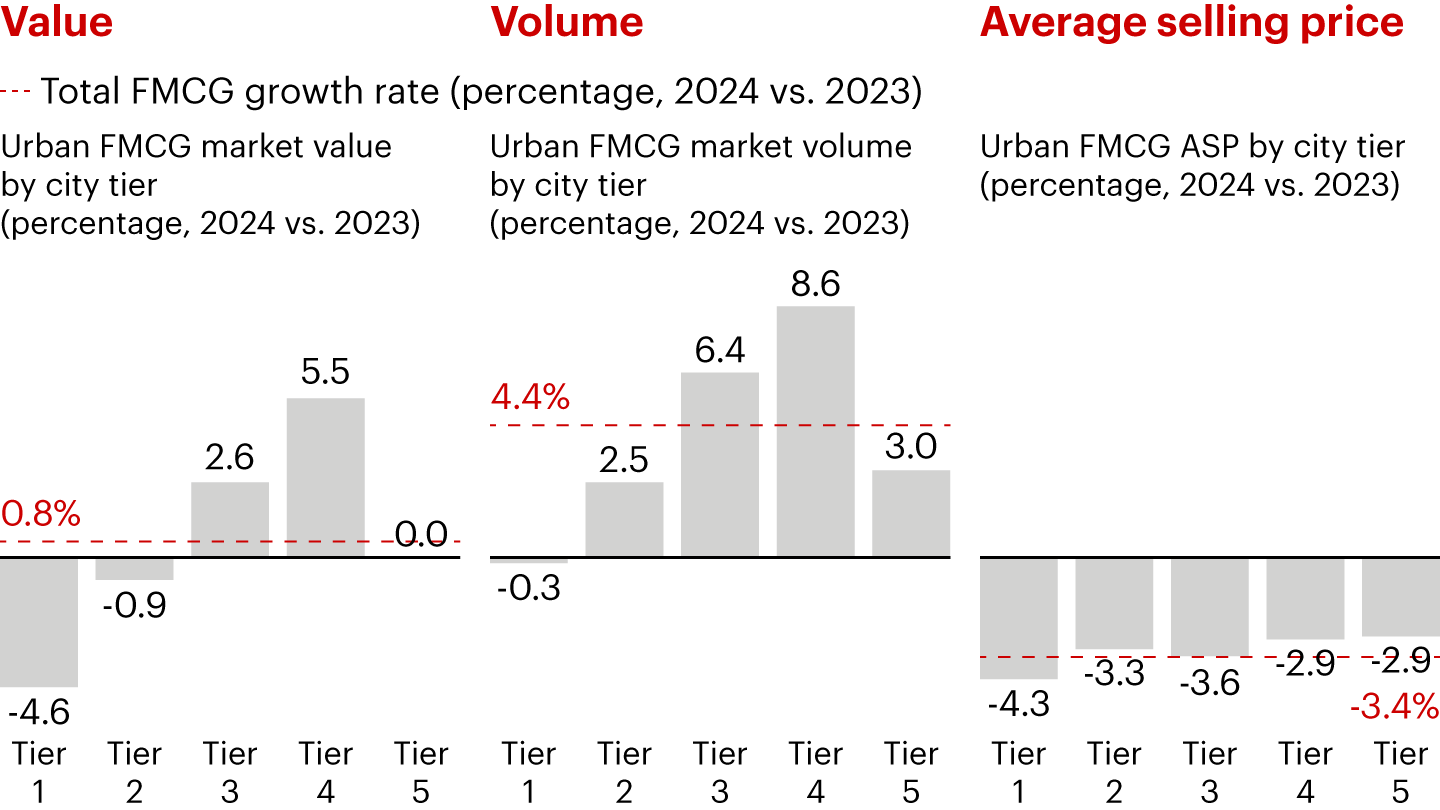
City tier performance shifted significantly in 2024 compared to prior years. From 2020 to 2023, Tier 2 cities were key growth drivers that consistently outperformed the market, while Tier 1 cities aligned with overall FMCG trends. However, in 2024, both Tier 1 and Tier 2 cities underperformed the market, and Tier 3 and Tier 4 cities emerged as growth drivers (see Figure 3). The shake-up was largely driven by volume growth disparity.

Notes: Tier 1 cities: Beijing, Shanghai, Guangzhou, Chengdu; Tier 2 cities: provincial capital cities excluding Guangzhou and Chengdu, plus Tianjin, Chongqing, Shenzhen, Dalian, Qingdao; Tier 3 cities: prefecture-level cities, excluding Dalian and Qingdao; Tier 4 cities: county-level cities; Tier 5 cities: the residence of the county government
Sources: Worldpanel; Bain analysisThe decline among Tier 1 cities could partially be attributed to population outflows. The number of permanent residents living in Shanghai decreased by 72,000, while Beijing lost 26,000 permanent residents in 2024.
Growth in Tier 3 and Tier 4 cities was driven by a combination of demand and supply factors.
On the demand side, population aging drove higher consumption. Families with middle-aged parents (age 35–45) experienced household spending growth of +2.7% in Tier 3 cities and +3.6% in Tier 4 cities, outpacing average spending growth across all city tiers (+0.3%). Families with older parents (age 46+) saw household spending grow 3.3% in Tier 3 cities and +6.2% in Tier 4 cities, significantly above the +2.0% average for all city tiers.
Spending among older parents is increasing faster for several reasons. These consumers accumulated considerable wealth during China’s period of rapid economic growth and have stable pensions. Their mindset is also evolving, placing higher value on better quality of life.
On the supply side, both online and offline channels grew in Tier 3 and Tier 4 cities. Offline, super/mini formats achieved +8% growth rates in Tier 3 cities and +7.3% in Tier 4, driven by increasing purchase frequency and rising ticket size across different categories, exceeding the overall average of +4.7%. In Tier 4 cities, the convenience store channel grew +3.5% compared to the market average of -1.3%, and grocery was up +15.9%—nearly double the overall market average of +8.5% growth.
Tier 3 and Tier 4 cities also outperformed the market in online growth, posting +4.4% and +10.5% growth, respectively, compared to the market’s +2.3% growth rate.
Category leaders are becoming increasingly reliant on Tier 3 and Tier 4 cities to achieve their growth goals. The fabric detergent brand Blue Moon (蓝月亮) strategically prioritized lower-tier cities for channel expansion, earning growth rates above +5% in those tiers.
Category update: Home care led the sector’s growth, while personal care continued to struggle
Home care continued to lead FMCG growth, expanding by +2.4% annually after a robust performance in 2023. Packaged food and beverage followed, with annual growth at +2.0% and +1.5%, respectively. Personal care continued on a downward trend, dropping to -2.3% (see Figure 4).
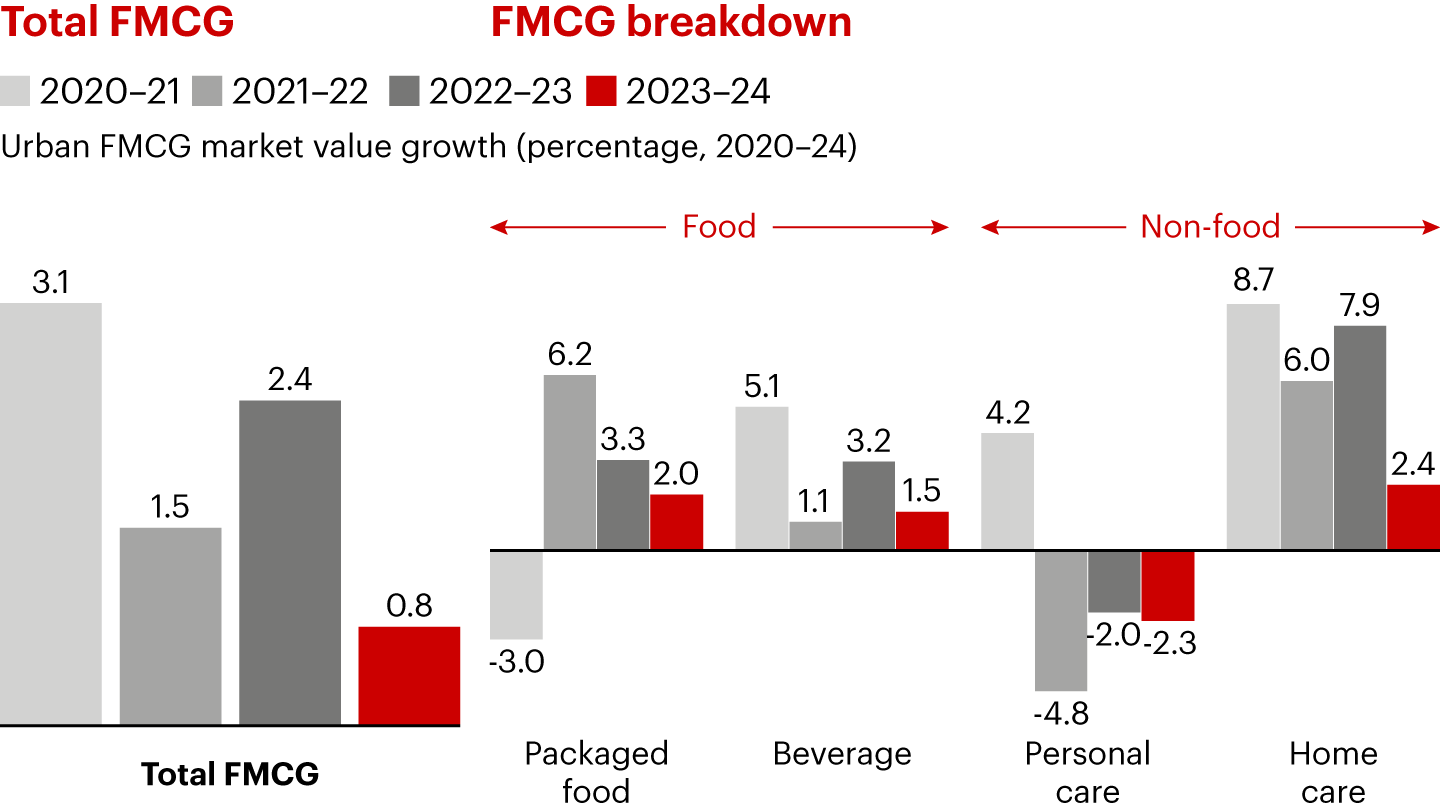

Home care’s +2.4% growth was driven by strong volume gains and steady demand for hygiene products. Facial tissue (+5.6%), fabric detergent (+4.2%), and kitchen cleaner (+6.1%) all grew in 2024.
Packaged food ranked just behind home care, with +2.0% growth. Volume rebounded, with packaged food growing +2.7% in 2024 after posting -1.5% growth in 2023. Premiumization stalled, however, with ASP down -0.6%. All major packaged food subcategories posted volume growth in 2024 except for infant formula, which saw a -5.6% decline.
Beverage grew +4.0% in Q1 and +5.9% in Q2 but declined in the second half of the year (-0.6% in Q3 and -2.6% in Q4). The drop was caused by price reductions; ASP fell by -4.6% and -6.9% in the last two quarters. Juice led the beverage category with +19.1% growth thanks to higher ASP (+3.7%) and increased demand for health and nutrition products. Instant coffee growth was also fueled by trade-up (ASP +7%) and increased demand for high-quality coffee. Dairy products such as milk (-5.2%) and yogurt (-4.1%) continued to decline.
Personal care also followed a downward trend, reporting negative growth in 2024 (-2.3%) and 2023 (-2.0%). Volume growth (+4.8%) was offset by a sharp ASP drop (-6.8%), making 2024 the third consecutive year for negative growth. Skincare (-4.2%) and makeup (+0.0%) continued to face challenges, partly because medical cosmetology has become an increasingly competitive alternative over the past few years. Baby diapers declined sharply (-11.6%) due to fewer births. Toothpaste was the only growth highlight (+6.0%). Its growth was driven by a higher frequency of teeth brushing and category premiumization related to functional claims (e.g., whitening).
In 2024, the two-speed phenomenon persisted, and growth was primarily driven by essential health and hygiene needs (see Figure 5).
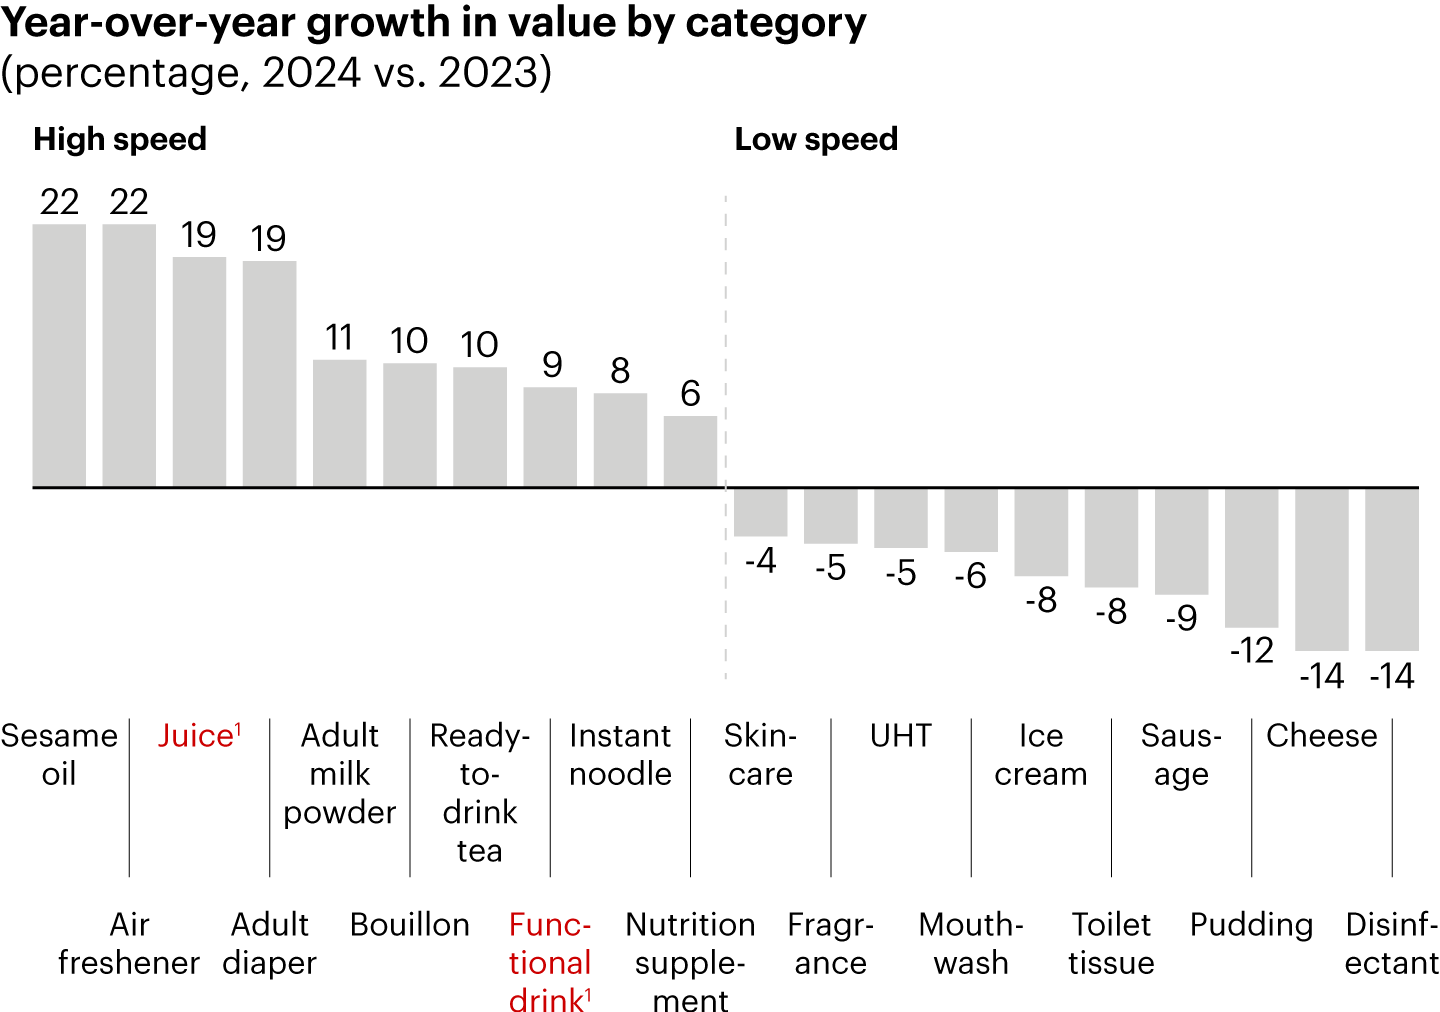

Notes: (1) The juice and functional drink categories grew three consecutive years in a row (no categories declined three years in a row); Two-speed growth is calculated based on the categories applicable to all households; baby categories (e.g., infant formula and diapers) are not included; UHT = ultra-high temperature milk
Sources: Worldpanel; Bain analysisHigher-growth categories were volume-driven, while lower-growth categories faced declines in both volume and price.
Hygiene and health-related categories were major contributors to high-growth segments, with juice and functional drinks consistently increasing value for three consecutive years. Growth in functional drinks was driven by high-pressure lifestyles and specific occasions (e.g., post-workout). Two cooking-related subcategories, sesame oil and bouillon, experienced rapid growth as consumer preferences became more specialized, although these categories remained relatively small in scale. The adult diaper subcategory also grew rapidly to meet rising demand among an aging population.
In low-growth categories, new entrants such as skincare, fragrance, toilet tissue, and disinfectants emerged for the first time in three years, reflecting evolving market dynamics.
Channel update: The channel mix is still evolving, with online and offline channels showing distinct trends
In 2024, the online and offline channel mix for China’s FMCG market remained stable. The grocery and super/mini (including discount store) formats outperformed the market (see Figure 6). Online, Douyin maintained rapid growth, while other players were relatively stagnant.
Online channels: Douyin had a standout performance in 2024, surpassing JD to become China’s second-largest e-commerce platform (behind Taobao/Tmall) with a 23% share of online sales. After strong growth in 2023, momentum slowed for Pinduoduo and Kuaishou in 2024. Taobao and Tmall continued to lose market share to Douyin.
Offline channels: Grocery and super/mini stores regained momentum, primarily in Tier 3 and Tier 4 cities, where urbanization increased demand. Overall consumption patterns also recovered. Business models such as Online to Offline (O2O) and empowered supply chains also contributed to grocery and super/mini growth.
New offline retail formats: Specialist stores, such as snack collection stores, emerged as growth drivers (see Figure 6). The snack collection store is an emerging, specialized channel capturing growth in lower-tier cities. It caters to younger generations who want healthier and diversified snack options at attractive prices.
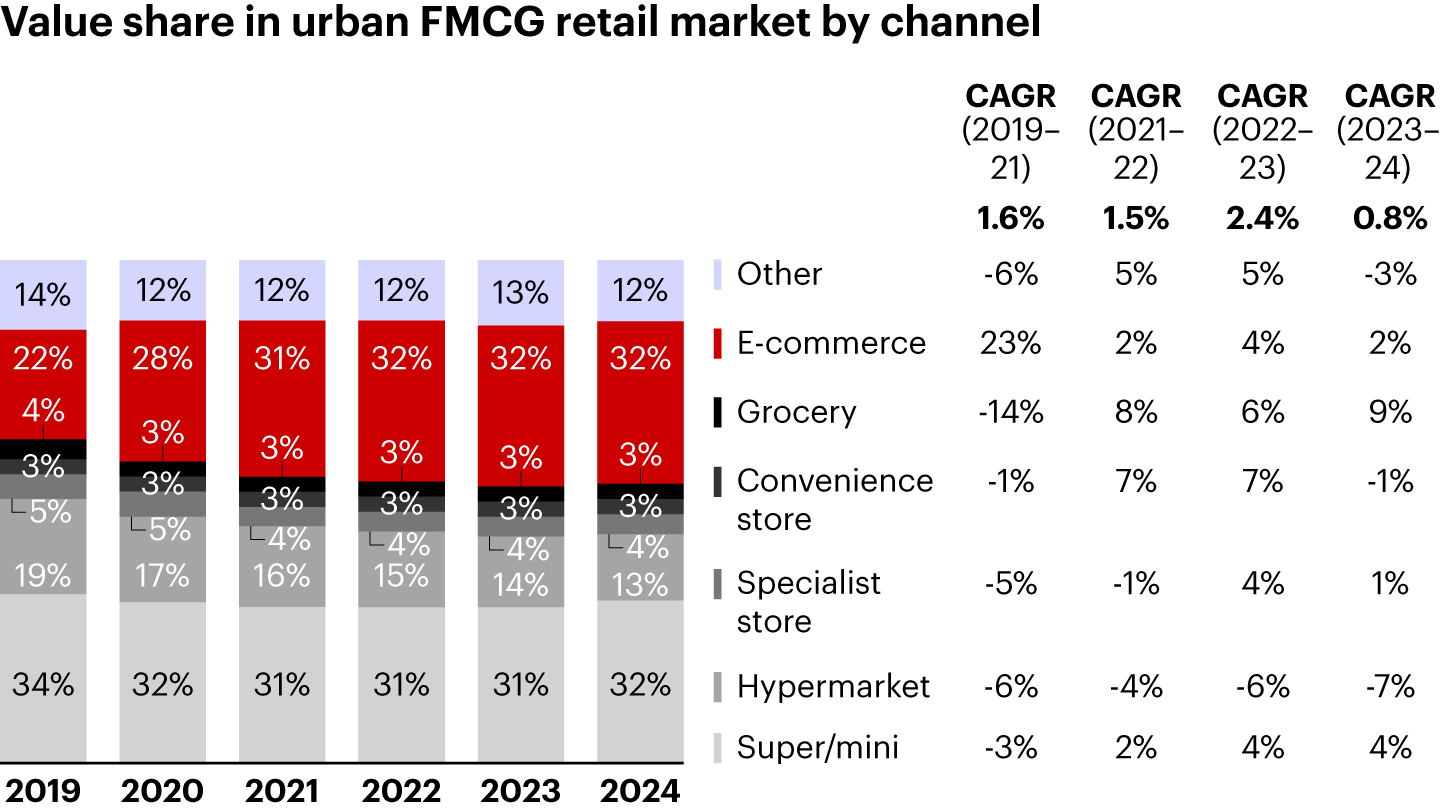

Notes: Worldpanel updated the consumer universe in 2023 and 2024, leading to some inconsistencies with previous years’ data; gift channel value is allocated into each channel by its respective weight
Sources: Worldpanel; Bain analysisMembership stores continued to see significant growth, contrasting with the overall hypermarket trend illustrated in Figure 6. Their growth is attributed to an increase in buyers (26%). Consumers are becoming more aware of these outlets, and appreciation for high-quality product offerings has grown. Frequency held at +1.6%, while spending per trip dropped -6.5% because of the downward pricing trend. The growth potential for membership stores remains promising, considering the headroom to expand penetration.
The discount store is a notable and growing channel within the super/mini retail sector illustrated in Figure 6, although it currently skews toward young, high-tier generations. Discount stores have adopted a variety of models in China. For example, HotMaxx attracts shoppers by offering near-expiry products at low prices and by creating a “blind box” effect. Deals aren’t regularly repeated, so consumers are drawn to the store without knowing exactly what they’ll get. HotMaxx also serves as a testing ground for manufacturers to launch new products. Aldi’s model, on the other hand, emphasizes quality. It built a quality reputation in Shanghai, then gradually expanded its private-label product offerings.
Online penetration: Overall, online penetration is still growing, albeit moderately. In 2023, multiple clusters of categories followed different trends; in 2024, we saw clear polarization between two major categories: non-food and food (see Figure 7).
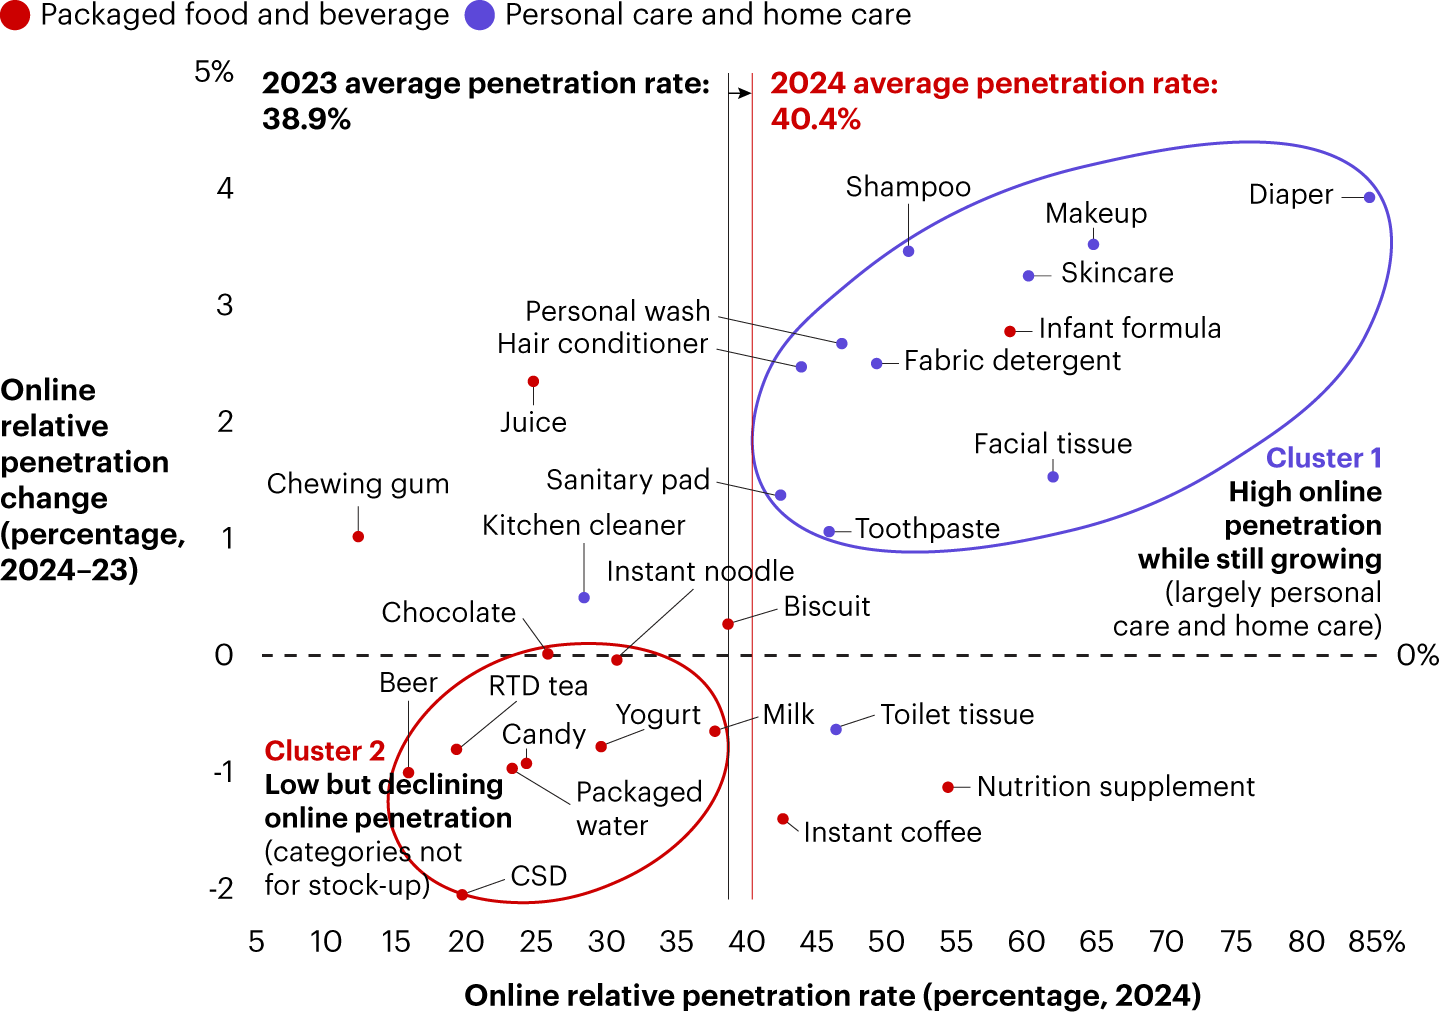

Notes: Online relative penetration is defined as the total number of online purchasers divided by the number of purchasers of the category; RTD tea = ready-to-drink tea; CSD = carbonated soft drink
Sources: Worldpanel; Bain analysisOnline penetration continued to grow in non-food categories despite these categories already having high growth rates. Consumers seem willing to order non-food products from low-price online platforms. Food products, on the other hand, are more prone to safety issues, leading consumers to purchase them offline, so online penetration declined in food categories.
In prior volumes of the China Shopper Report, we observed that promotion rates were much higher in online channels than offline. Online channels also featured more small brands and cheaper prices, especially in the personal care and home care categories. This may explain why the ASP declines in personal care (-6.8%) and home care (-4.0%) were more significant than the declines in packaged food (-0.6%) and beverage (-2.9%).
O2O: O2O growth slowed significantly in 2023 and continued on a clear downward trend in 2024, dropping -10.0% for total FMCG categories. Across platforms, community group buying and horizontal marketplaces declined drastically, while vertical e-commerce platforms experienced faster growth.
Historically, community group buying has been driven by price advantages. Now, it’s facing intense competition from discount stores and other formats. Under that pressure, community group buying declined 17.0% in 2024 and top players downsized to maintain profitability. Horizontal marketplaces such as Meituan and Ele.me are primarily perceived as food-service platforms and lack a competitive edge in the vertical grocery category. They saw an 18.0% decline in 2024.
Vertical grocery e-commerce was a standout performer, growing 26.0% in 2024. Post-Covid, consumers have embraced online grocers with reliable, on-time delivery. Leading platforms expanded while optimizing profitability through initiatives like category diversification and private-label offerings.
Brand competition: Both insurgent and domestic brands outperformed the market in 2024
Brand competition was still intense in 2024, with the top five brands losing share in more than half of FMCG categories (see Figure 8).


Diapers and infant formula consolidated into five top brands, with both categories declining due to lower birth rates. In the diaper market, small-scale brands struggled to maintain sales and profitability in an overall declining market, while leaders such as Huggies, Pampers, and Babycare continued to invest and gain share. Babycare, a domestic diaper brand that performs well in the premium market, invested in R&D to address consumer pain points and upgrade products with premium materials. It also strategically targeted young parents in top-tier cities with a higher capacity to pay premium prices. Babycare’s offline stores in shopping malls offer consumers a convenient shopping experience and serve as important vehicles for branding, user experience, and parent-child interactions. Its marketing approach also resonates with parenting philosophies adopted by ’90s moms and Generation Z, who tend to emphasize “freedom in the identity of motherhood.”
In the infant formula market, Yili, Aptamil, Friso, and Nestlé were the top-growing brands. Aptamil and Nestlé grew off their imported labels, which are perceived to be more reliable and deliver greater value for money compared to similar formulations.
In a contrasting trend, juice, instant coffee, facial tissue, nutrition supplements, and ready-to-drink (RTD) tea shifted toward fragmentation. In these emerging categories, growth was mainly driven by insurgent brands focused on healthy attributes and innovations that won shares away from traditional brands. In the juice market, niche brands and brands related to specific fruits with health attributes experienced fast growth. High pressure processing (HPP) juice from Freshippo, yuzu-based beverages from Yuzu Valley, and coconut water from Delgarden are three popular examples.
In the instant coffee market, the fast-growing brands focused on “high-quality” coffee, offering products that are similar to freshly ground coffee and have higher ASPs than traditional instant coffees, such as Moccona, Luckin Coffee, and Cha Latte.
The top facial tissue brands lost share to white-label and private-label brands when faced with deflation. In nutrition supplements, new products emerged to meet diverse nutritional needs. In RTD tea, high-sugar brands like Master Kong(康师傅) and WongLoKat (王老吉) lost share, whereas the sugar-free segment boomed alongside the growing health trend.
Domestic brands gained share from foreign brands on an aggregate basis in nearly half of the 27 categories we tracked (see Figure 9). Foreign brands gained share in three categories (biscuit, candy, and infant formula), and share was stable in 11 categories.


Notes: (1) Foreign brands scanned based on Worldpanel’s “top performing brands” in all 27 categories; brands categorized as “foreign” and “domestic” according to the largest shareholder; (2) Worldpanel updated the consumer universe; skincare and makeup covers ages 15 to 64; all categories cover Tier 1 to Tier 5; changes may lead to some inconsistencies with previous years’ data; toilet tissue here refers to traditional tissue roll; CSD = carbonated soft drink
Sources: Worldpanel; Bain analysisOver the past decade, domestic brands have gained market share through product innovation and channel expansion. For example, Blue Moon gained market share by introducing a new “concentrated” fabric detergent and expanding its presence on Douyin. For makeup, shampoo, and hair conditioner, domestic share has been increasing for several years. Bee & Flower (蜂花) is a leader in hair care thanks to its low-pricing strategies and heritage-focused branding. It also regained popularity by building a strong presence on online social platforms.
Foreign brands gained market share in infant formula, candy, and biscuit. Biscuit growth was primarily driven by membership store expansions, which supported growth among customized brands (e.g., Member’s Mark, Tafe). In candy, Nestlé brands gained share through product and channel synergies, particularly with Hsu Fu Chi and other international brands.
Since 2012, domestic brands have demonstrated a strong and steady ability to gain shares from foreign brands on an aggregate basis—claiming 76% of the market in 2024 (see Figure 10). Both new and established domestic brands contributed to the increase in share by introducing innovative products, pricing products competitively, and diversifying distribution channels. The consistency of this long-term trend suggests a meaningful shift in consumer preferences and market dynamics.
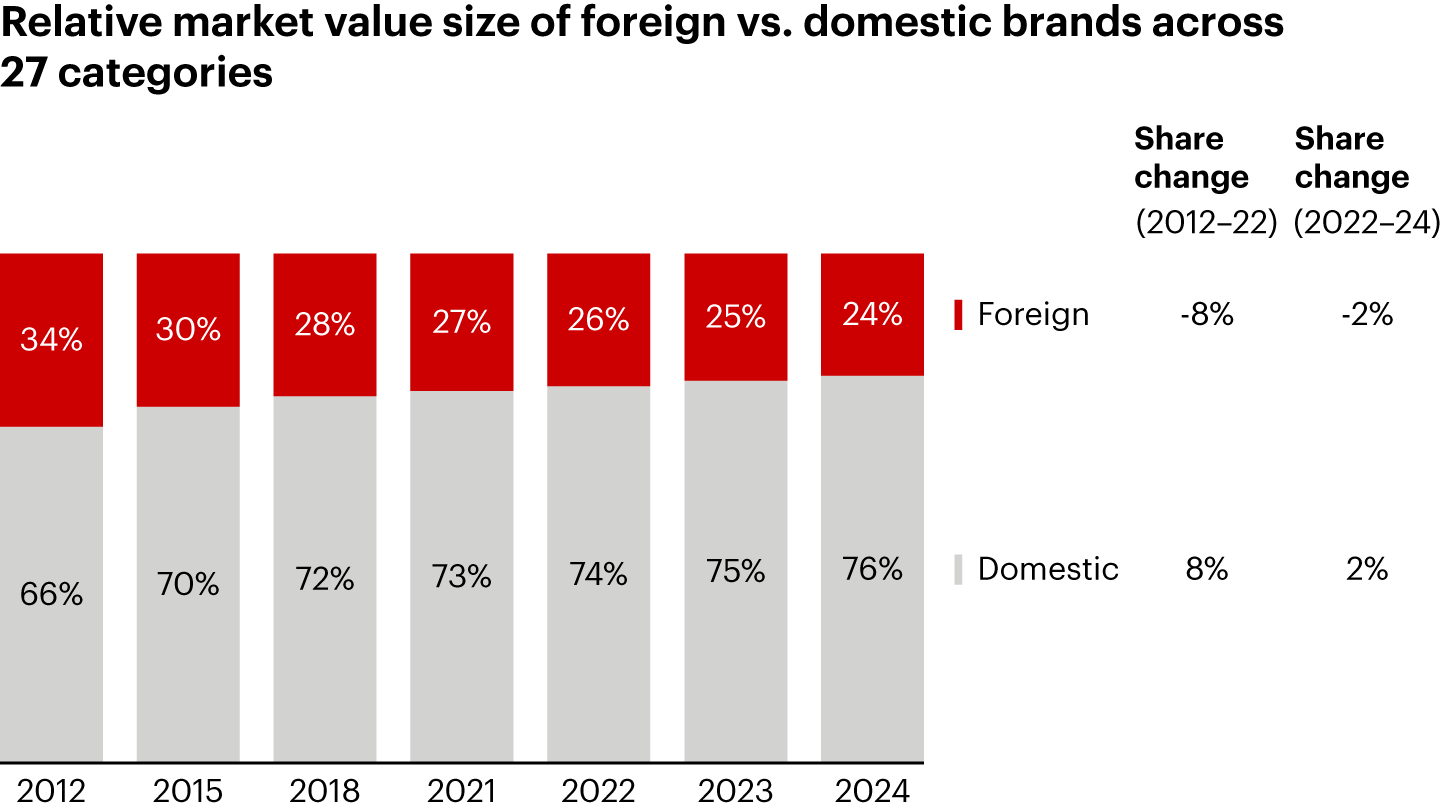

Notes: (1) Foreign brands scanned based on Worldpanel’s “top performing brands” in all 27 categories; brands categorized as “foreign” and “domestic” according to the largest shareholder; (2) Worldpanel updated the consumer universe; skincare and makeup covers ages 15 to 64; all categories cover Tier 1 to Tier 5; changes may lead to some inconsistencies with previous years’ data
Sources: Worldpanel; Bain analysisQ1 2025 perspectives and early pricing trends
After a challenging 2024 for FMCG, Q1 2025 started strong. The sector achieved +2.7% year-over-year growth, thanks to a sharp spending spike around the Chinese New Year festival (see Figure 11).
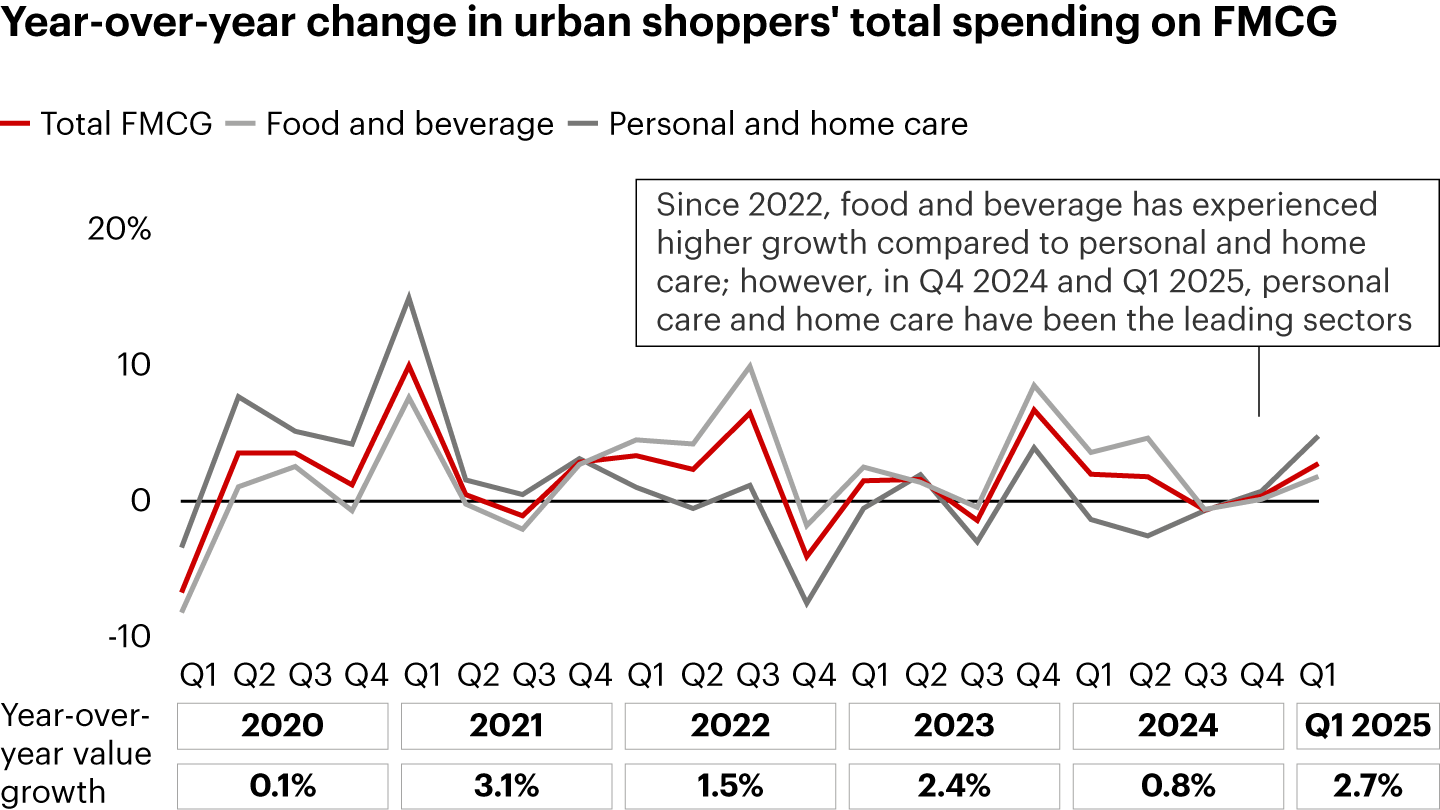

Note: Worldpanel updated the consumer universe, leading to some inconsistencies with previous years’ data
Sources: Worldpanel; Bain analysisSome macroeconomic indicators improved in Q1 2025. In Q1 2025, GDP growth (5.4%) was consistent with the previous year (5.3%). Other core indicators, such as consumer confidence, were unchanged. However, the government announced in Q1 more policies to support domestic consumption, which should result in higher consumption growth overall in 2025 and beyond, including FMCG.
Volume is driving growth—again
Value growth in Q1 2025 (2.7%) was driven by overall volume growth of 5.3%, which is much higher than the sector experienced in Q1 2024 (see Figure 12). The ASP decrease (-2.5%) was moderate compared to the prior three quarters. However, based on previous years’ data, Q1 pricing may not represent the full-year trend.
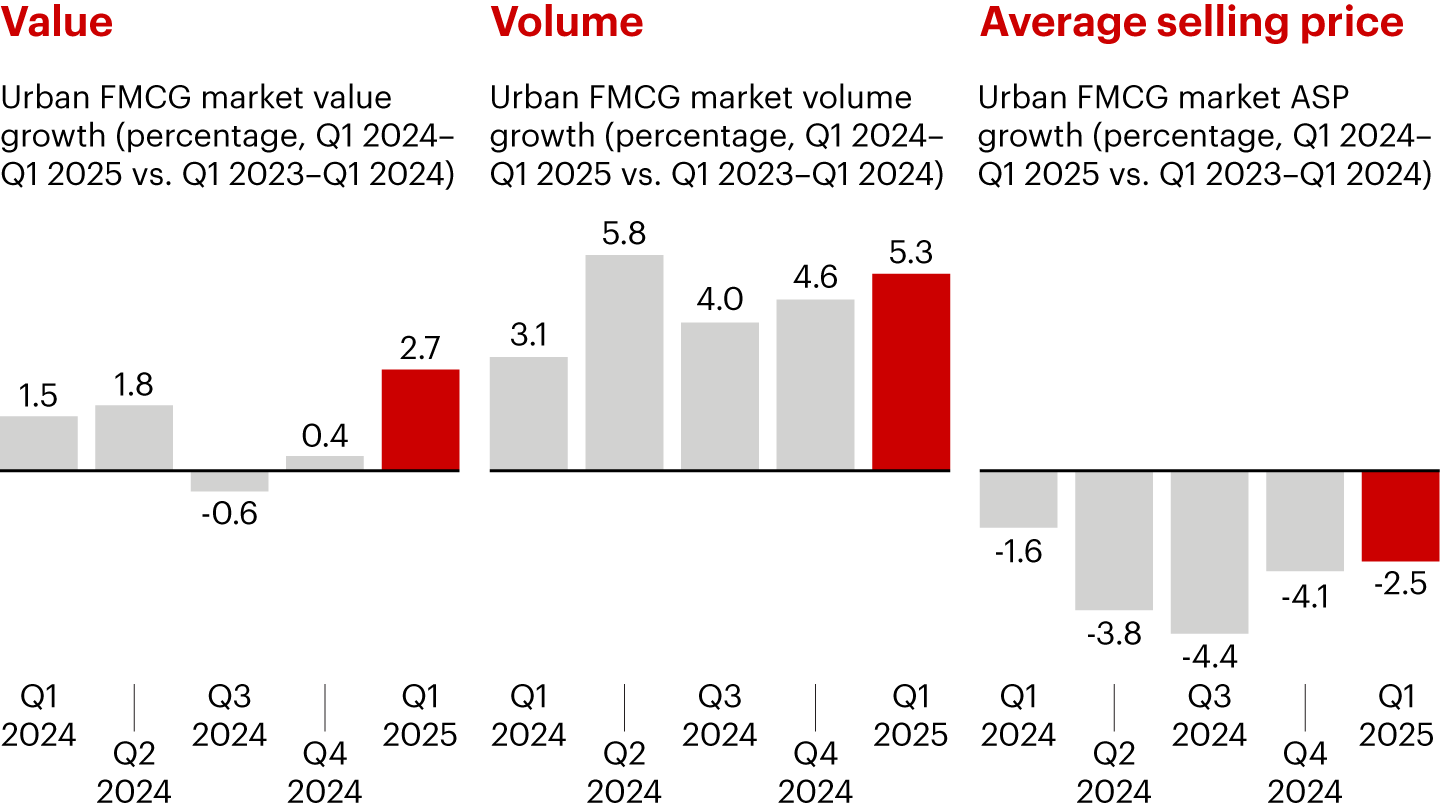

Notes: Worldpanel updated the consumer universe, leading to some inconsistencies with previous years’ data; all average selling prices are calculated based on RMB per kg/L except diapers per piece, skincare and makeup per pack, and toilet and facial tissue per 100 sheets/rolls
Sources: Worldpanel; Bain analysisThe home care, personal care, and packaged food categories increased in value, while beverage growth stagnated (see Figure 13). Personal care value grew rapidly (+4.0%), driven by volume growth. Home care maintained the top position in value growth (+6.1%) thanks to substantial volume growth. Packaged food also saw robust value growth (+3.2%), while beverage grew a slight +0.5%.
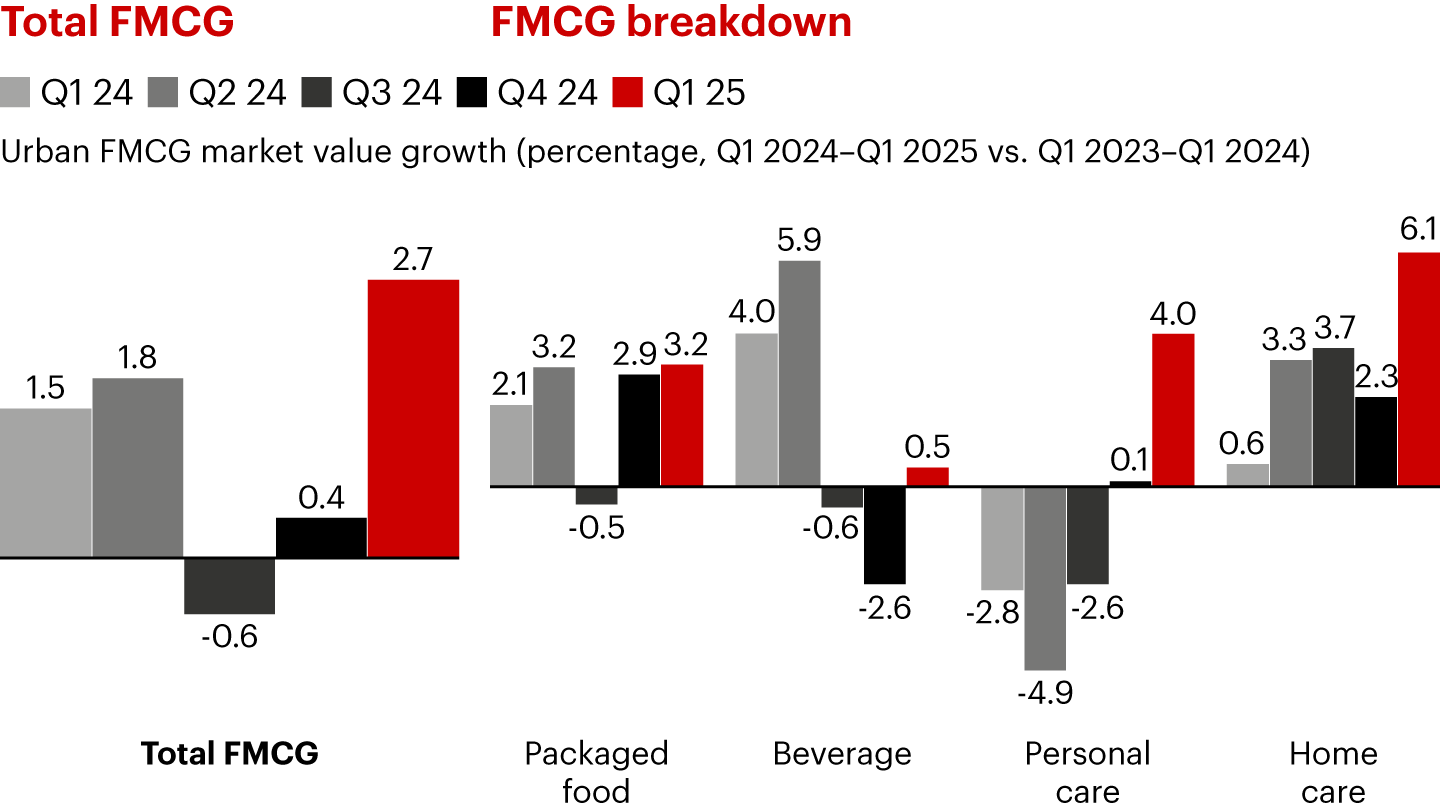

Packaged food value growth was driven by a +4.6% volume increase. Instant noodle continued to lead in value growth (+7.4%), mainly driven by volume growth as consumer demand for convenience increased. Nutrition supplements also achieved strong value growth (+6.2%) and sizable volume gains (+16.2%), even though ASP continued to decline (-8.6%). Insurgent local brands entered the segment with low-price offerings. Infant formula experienced a decline (-1.5%) for structural reasons; however, that trend has been smoothed.
Beverage segment value grew +0.5% and volume increased +4.7%, but this was offset by a -4.0% ASP drop. Performance across beverage subcategories varied. Juice (+16.6%), packaged water (+11.6%), beer (+5.7%), and RTD tea (+5.7%) experienced high growth, consistent with 2024. Segments with strong correlations to health (e.g., 100% juice, sugar-free) continued to be the strongest growth drivers. Beer increased +5.7% in value due to volume growth (+4.7%). In instant coffee, premiumization drove ASP +4.6%, resulting in 6.4% value growth. Milk (-4.7%) and yogurt (-5.1%) continued to decline, mainly because of ASP trade-downs (-3.8% for milk and -5.9% for yogurt).
Personal care experienced an increase in volume overall (+5.3%) despite an ASP decline of -1.2%. “Sacrificing price for volume” was the primary trend. All major categories of personal care saw significant drops in ASP: -6.3% for skincare, -7.2% for makeup, -6.4% for hair conditioner, and -6.1% for diaper. Only toothpaste maintained ASP (+0.2%), leveraging the rise of functional products and packaging upgrades. Every personal care category—except diaper and hair conditioner—achieved positive value growth by increasing volume.
Home care volume grew by +8.8% as demand for health- and hygiene-related products persisted. However, volume growth was partially offset by a -2.5% drop in ASP. Volume growth contributed to robust value growth for facial tissue (+7.1%), fabric detergent (+4.4%), and kitchen cleaner (+7.0%). Toilet tissue experienced declines in volume (-1.9%) and ASP (-2.2%) due to emerging alternatives, such as scenario-specific products.
Channel dynamics: Consistent with 2024, e-commerce and offline small-format stores continue to gain share
Channel dynamics continued to evolve in Q1 2025, consistent with our 2024 findings.
Douyin continued to be a strong player online, growing rapidly and stealing share from Taobao and Tmall. Pinduoduo also witnessed double-digit growth (+11%), driven by higher market penetration and purchase frequency despite an overall deflationary trend.
Many brands, especially in the home care and personal care segments, established a strong presence on Douyin, using livestreaming to capture market share. Chinese New Year promotions were more aggressive on Douyin in Q1 2025, too.
Pinduoduo saw drastic growth in Q1 2025 (11%), outgrowing the online market overall. Penetration and frequency both rose steadily, while price per volume decreased. This signals that Pinduoduo is continually able to attract consumers who want affordable options. Taobao and Tmall continued to shrink, mainly losing share to Douyin.
After declining in 2024, O2O channels lost even more momentum in Q1 2025, as shoppers returned to offline stores. Community group buying and horizontal marketplaces declined drastically, while offline retailers and vertical grocery e-commerce both grew.
Community group buying decreased -12% in Q1 2025, falling out of favor post-Covid. Horizontal marketplaces saw a sharp decline (-31%) in Q1 2025, replaced by more FMCG-focused platforms. Offline retailers grew rapidly (+23%) in Q1 2025, fueled by sustained growth in Sam’s (+55% in 2024 and +63% in Q1 2025) and a rebound for Freshippo (-9% in 2024 and +32% in Q1 2025). Freshippo’s growth was mainly driven by store expansion, particularly among dark stores that leverage the O2O model for fulfillment. Vertical grocery e-commerce grew rapidly (+31%), fulfilling consumers’ desire for convenience.
Grocery and super/mini stores maintained their growth trends from 2024, with strong performances in Tier 3 and Tier 4 cities—which were the top growth contributors for the FMCG market overall.
Pricing deep dive: The deflationary trend prevails
Trade-down has been a topic of great concern over the past three years (see Figure 14). Looking at quarterly performance from Q1 2022 to present, ASP has declined almost every quarter (Q2 and Q4 2023 were the exceptions). The deflationary trend became more pronounced starting in Q2 2024. Considering this, we wanted to explore price performance across various FMCG subcategories to understand the drivers behind this price deflation.
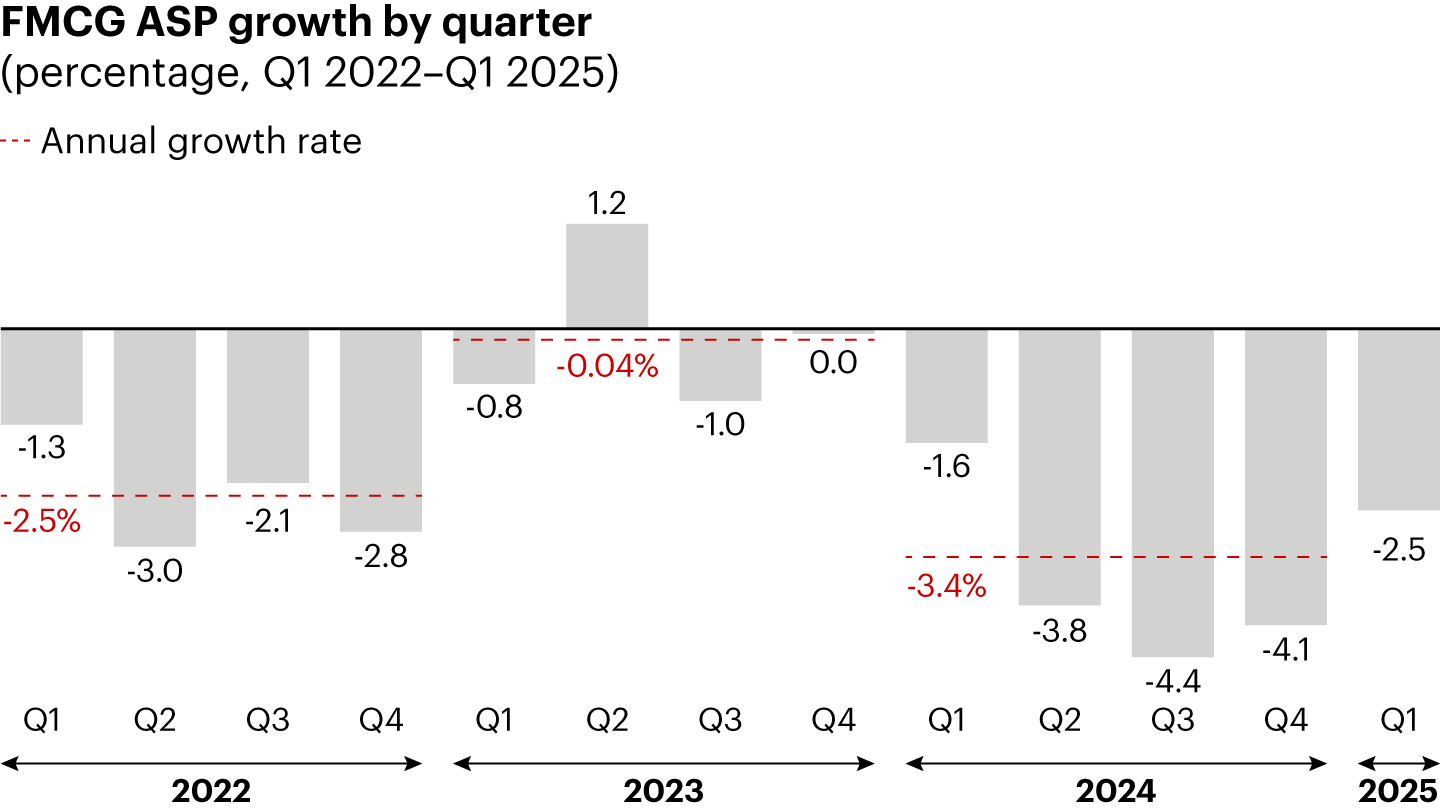

Note: Worldpanel updated the panel universe, which may lead to slight differences in growth rate for past years
Sources: Worldpanel; Bain analysisPricing dynamics in four main categories
To understand pricing dynamics, we examined average household spending in four categories: packaged food, beverage, home care, and personal care (see Figure 15).
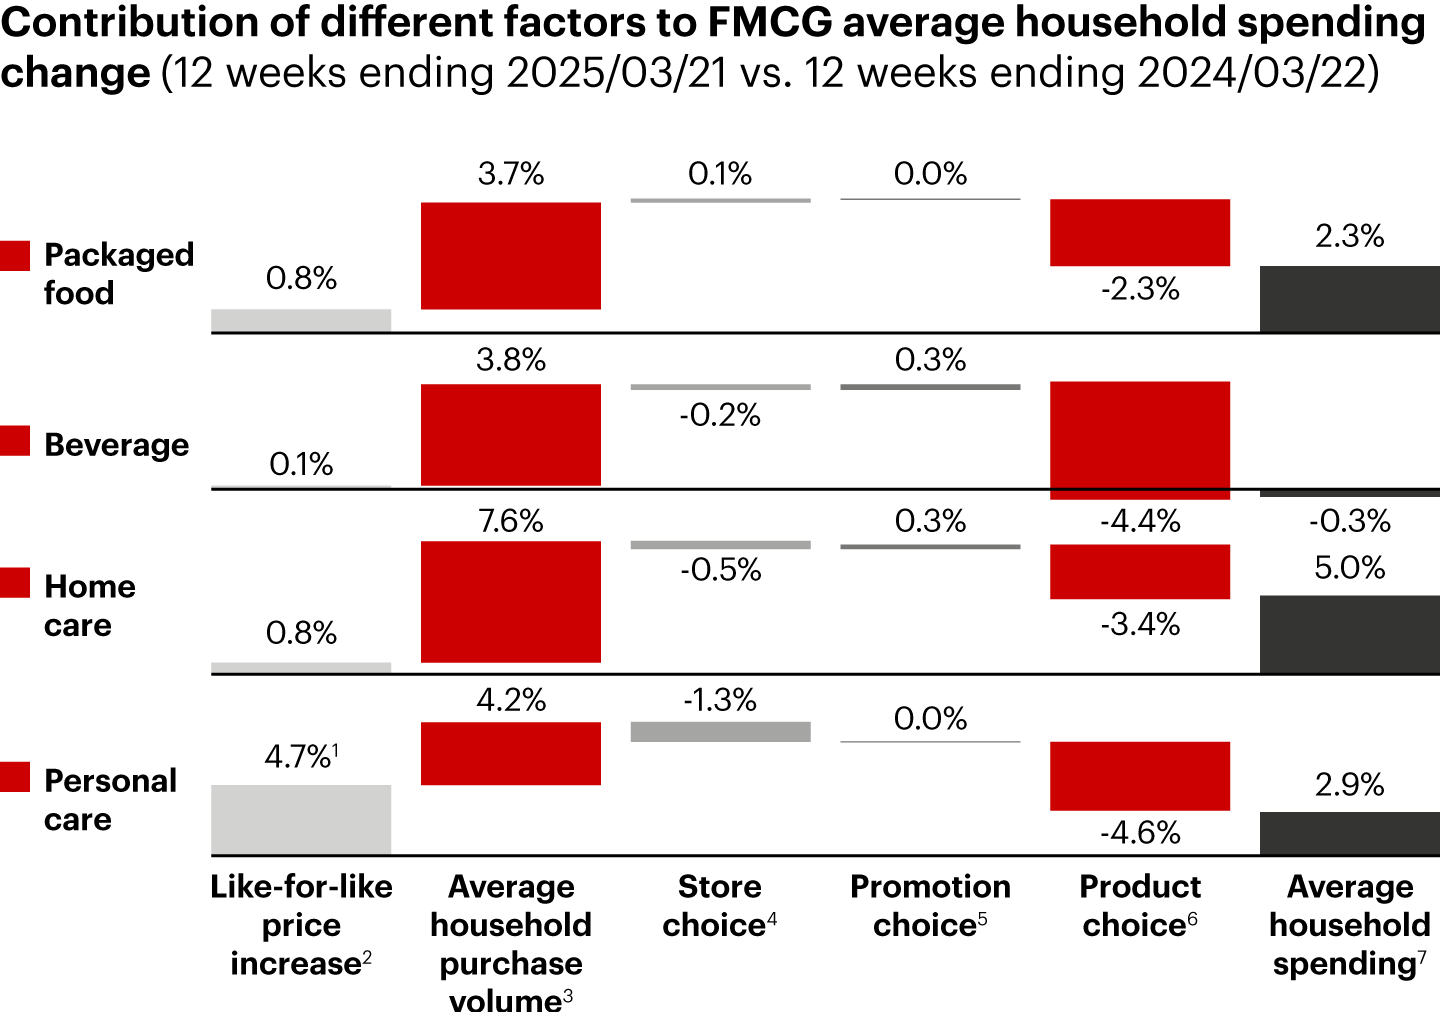

Notes: (1) Unusual inflation was mainly due to price hikes in Q1 2025 in skincare, makeup, and perfume Excluding these, the inflation for personal care was around 1%; (2) Overall like-for-like-price increase for existing SKUS; (3) Shoppers are buying more FMCG categories and/or a higher volume within certain categories; (4) Shoppers are buying in fewer premium stores/channels; (5) Fewer promotion events or lower discount; (6) Shoppers are choosing a less expensive product; (7) Shoppers are spending more/less on FMCG vs last year; Analysis only reflects the average shopping behavior of single households and is not comparable to the total FMCG trend
Source: Worldpanel Advanced AnalyticsSpending per household grew in three categories in Q1 2025, mainly driven by strong growth in consumption volume (i.e., households purchased more products to satisfy their daily needs). Then we looked at drivers that affected overall spending, such as store choice, promotion choice, and product choice.
Regarding channel preferences, as mentioned earlier in this report, consumers are increasingly gravitating toward value-for-money channels, such as discount stores, snack collection stores, and online platforms like Douyin and Pinduoduo. These channels prioritize cost-effectiveness, consistently offering products at lower prices rather than running temporary discounts or promotions.
However, the biggest driver affecting total household spending was product choice, namely downtrading. A downtrading trend was consistent across all four major categories. Consumers were able to increase volume by seeking more affordable alternatives to products they used to purchase.
ASP dynamics across 27 subcategories
The deflationary trend is also prevalent at the subcategory level. In Q1 2025, a majority of categories—excluding juice and instant coffee—struggled to increase ASP from 2024 (see Figure 16).


Notes: RTD tea = ready-to-drink tea; CSD = carbonated soft drink
Sources: Worldpanel; Bain analysisAmong the outliers, juice witnessed both volume and ASP growth because of increased demand for healthy and nutritious beverages. Freshippo and Yuzu Valley both benefited from this health-conscious consumption environment. Freshippo grew a remarkable +132% from 2023 to 2024. Its private-label juice line, which emphasizes 100% juice (not from concentrate), gained massive popularity in the market, as did its products that use HPP technologies (e.g., apple juice, pineapple juice). Freshippo also rapidly expanded its store footprint to help capture a larger market share. Yuzu Valley’s yuzu-based drinks also increased sales rapidly, growing 44% from 2023 to 2024. Its success is attributable to its products’ high vitamin C content, absence of additives, and refreshing taste.
The instant coffee category also experienced substantial growth in ASP, matching consumers’ increasing demand for more sophisticated, high-quality coffee. Moccona and Luckin Coffee both capitalized on this trend. Moccona uses low-temperature, freeze-dried technology to replicate the taste of freshly brewed coffee. It also offers a diverse range of flavors and options, including low-caffeine alternatives. Luckin launched a range of instant coffee products (both solid and liquid) that taste similar to coffee made in the shop. It’s also suitable for mixing (e.g., with coconut milk), so consumers can make specialty coffee at home.
Toothpaste also had a relatively high ASP growth rate from 2023 to 2024 due to growth in the whitening segment, which has a higher ASP. On the demand side, whitening is the largest functional market (21.7% in value in FY 2024), and its popularity is increasing due to a rise in social events. Among suppliers, brands like Colgate (高露洁) and SAKY (舒克) are aggressively investing in the segment. Colgate adopted a “China-for-China” strategy, prioritizing whitening products over global “hero” SKUs. That approach helped increase sales and boost industry trade-up.
Premium segment performance
We also analyzed the premiumization trend by pricing tier in 17 subcategories (see Figure 17). Among them:
- Eight subcategories saw relative declines in the premium segment vs. the mainstream and mass segments.
- In four categories—juice, instant coffee, toothpaste, and sanitary pads—the premium segment outgrew the market.
- In five categories, there was no significant change between the premium segment and category growth overall.
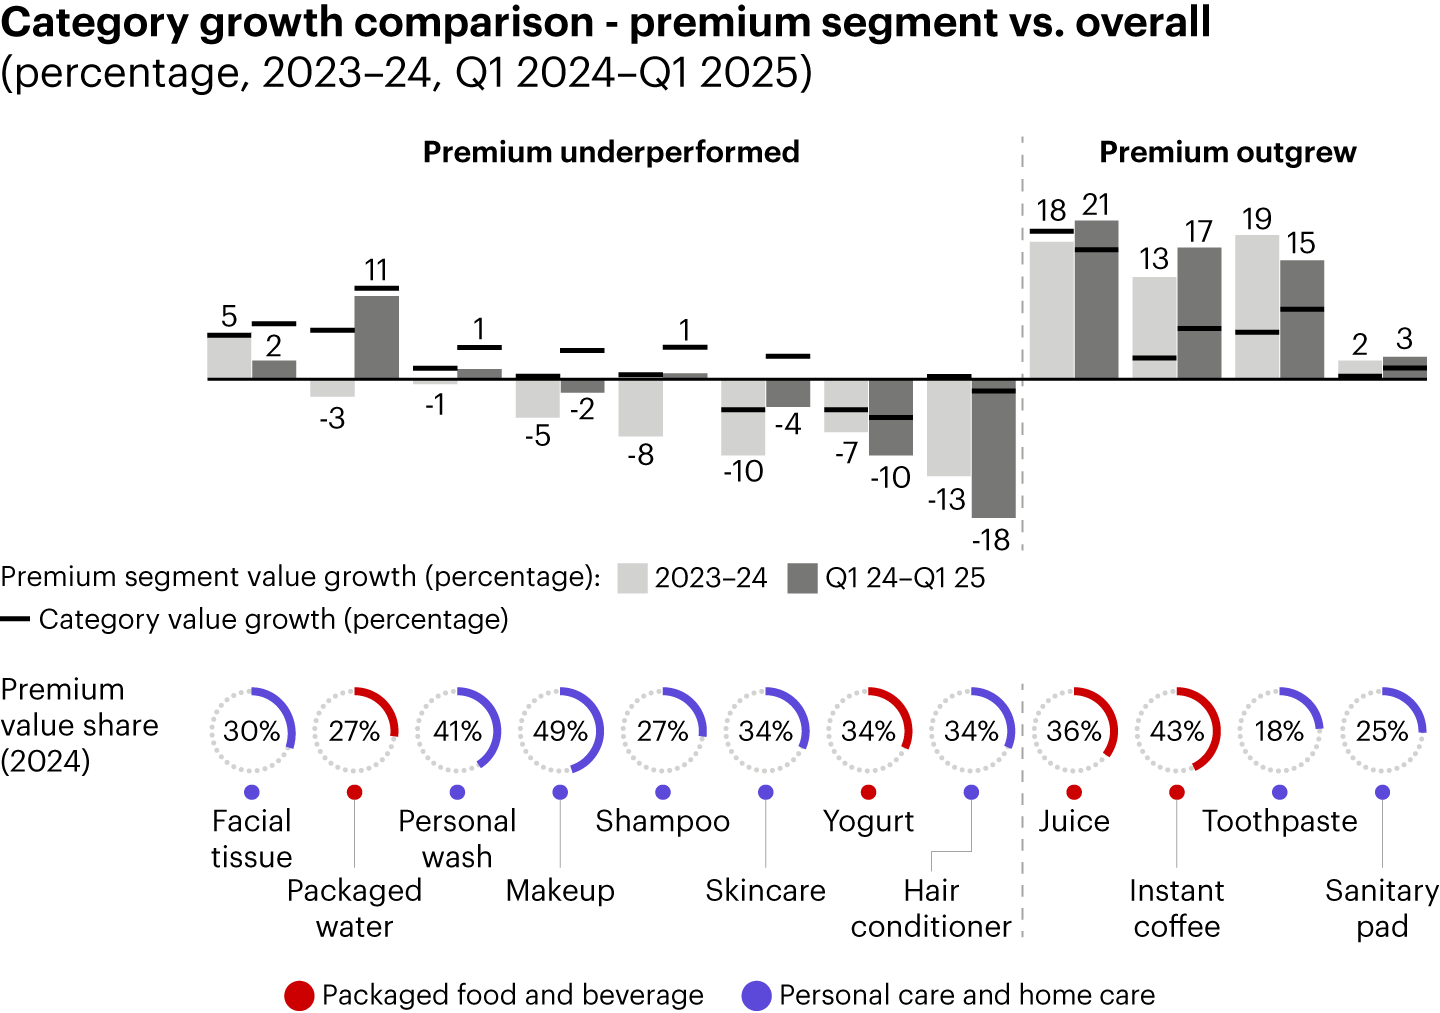

Notes: For personal wash/makeup/shampoo/skincare/yogurt/hair conditioner/toothpaste/sanitary pad, price tier is defined by which price tier the specific brand belongs to; for facial tissue/packaged water/juice/instant coffee, price tier is defined by the comparison of product ASP vs. category ASP, where price greater than a price index of 150% counts as premium, 80%–150% counts as mid-range, and below 80% counts as mass
Sources: Worldpanel; Bain analysisCategories with declining shares of the premium segment:
The premium segment saw a decline in value for facial tissue, packaged water, personal wash, makeup, shampoo, skincare, yogurt, and hair conditioner. Vinda (维达), Breeze (清风), and C&S Paper (洁柔) are top facial tissue brands that lost share; in their segment, value primarily shifted to white-label and private-label brands when consumption deflated. In hair conditioner, domestic brands grew drastically in the mass tier.
Categories where the premium segment grew share:
In the premium segment, juice, instant coffee, toothpaste, and sanitary pads outgrew the market overall, driven by innovations and product upgrades. As mentioned, toothpaste experienced a notable trade-up trend due to a surge in the whitening segment, which typically has a higher ASP. Sanitary pads also saw growth in the premium segment. Sanitary pad brands are investing in product upgrades as young women become more educated about menstrual health and pursue safer and better options.
Categories with stable share across price segments:
In instant noodles, fabric detergent, beer, infant formula, and carbonated soft drinks, there were no clear shifts between the premium segment and other price segments, or the trend reversed compared to 2024.
Pricing implications for brands:
The 2025 pricing environment is challenging, with consumers trading down and premium segments losing share or merely holding stable. Brands face a strategic choice: Specialize in the premium segment or determine how to compete in the mass/mainstream segments.
To find the right path, brands need to ask themselves:
- Is there enough growth potential to compete only in the premium segment?
- Is the brand really perceived as premium by consumers?
- If the brand isn’t up to premium status, how will it compete in the mass/mainstream segments, where price and cost pressures are higher?
- How will it compete against local brands, which tend to dominate the mass/mainstream segments?
These challenges are a classic manifestation of Bain’s Elements of Value® framework. In line with Maslow’s hierarchy of needs, Elements of Value measures consumers’ perceptions of 31 attributes across four categories: functional, emotional, life-changing, and global impact (see Figure 18).
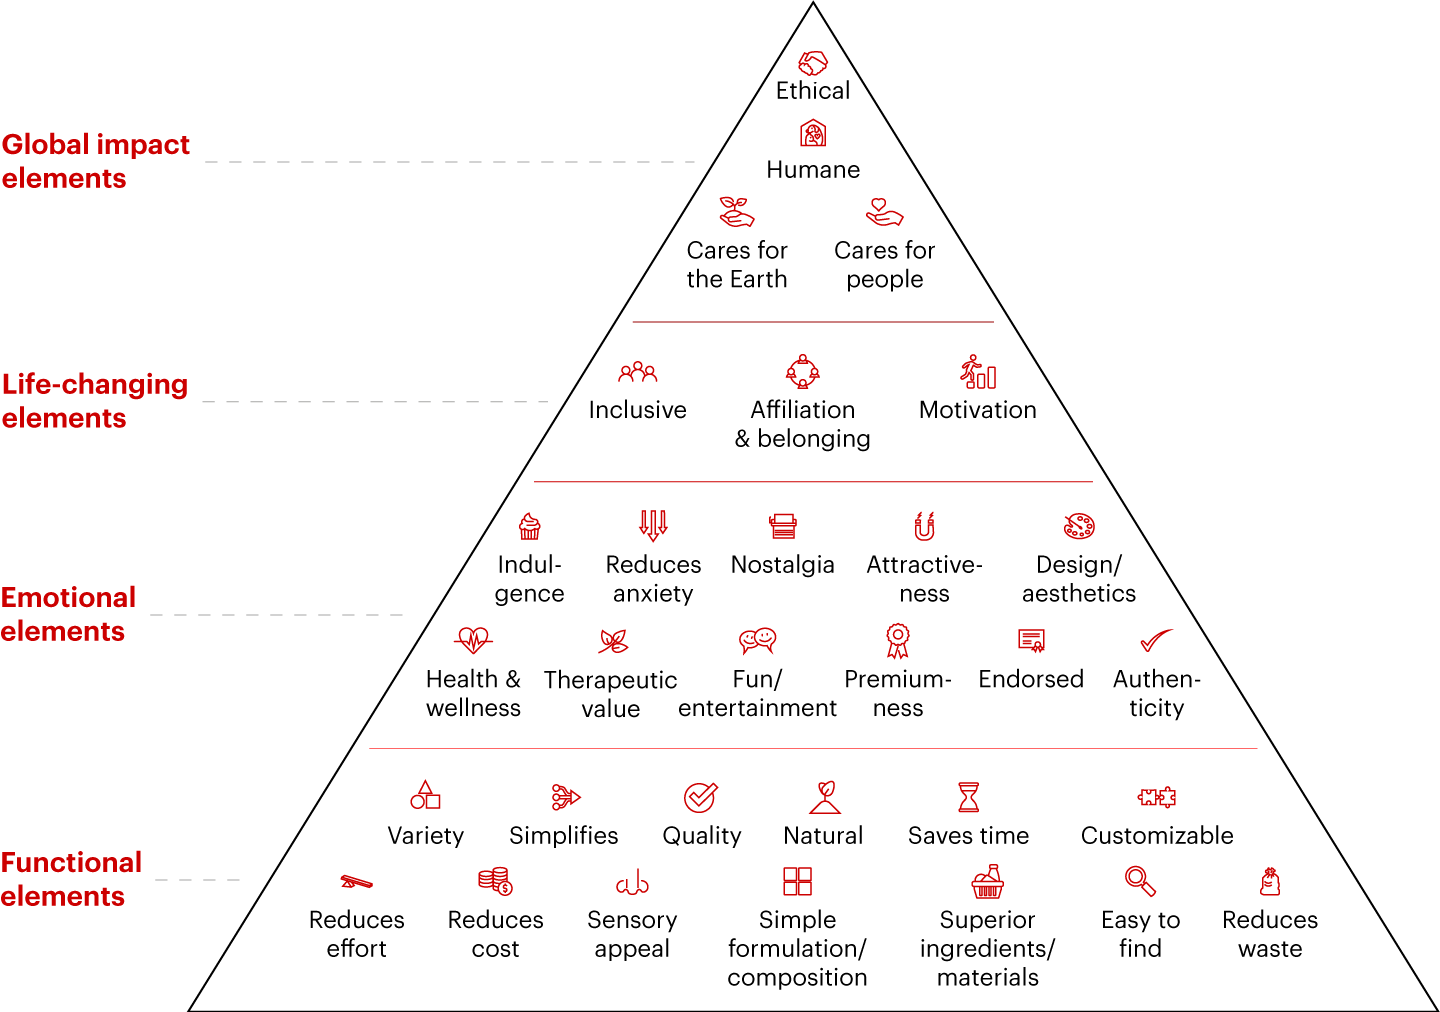

Based on the 2022 Bain Elements of Value Survey, mass market brands primarily focus on the functional and emotional elements of value, while premium brands usually hit higher elements of value, such as health and wellness, affiliation and belonging, care for the Earth, and being ethical. In the current trading down environment, premium brands need to assess which elements of value they deliver to consumers as compared to cheaper alternatives, and whether they are truly perceived as premium brands by today’s consumers. By out-delivering on several higher elements of value compared to their alternatives, these premium brands could command higher prices than rivals.
It’s possible to compete in both the premium and mass/mainstream segments, and many companies do so successfully. Vinda adopts a dual approach, with distinct brands in different price segments. In the premium market, Vinda’s Tempo brand evokes a high-end image, backed by continuous innovation, tight control over raw materials, and strict quality standards. In marketing and sales channels, Tempo conveys the brand concept of “Sophisticated Living” through intellectual property collaborations and by creating offline pop-up spaces that deliver tangible brand experiences. As a result, Tempo’s premium line of soft facial tissue achieved 63.0% growth, and its premium line of cored roll toilet paper achieved 106.0% growth in 2024.
In the mid-high-end segment, Vinda maintains its brand position by leveraging procurement advantages in pulp. This strategy optimizes cost-effectiveness so Vinda can increase volume without raising prices, thereby increasing value and strengthening its competitiveness. Vinda also uses livestreaming channels to attract more brand users. Such promotions increased traffic for its coreless roll toilet paper by 13.0%.
Vinda is also expanding into related product categories, such as hygiene products with high gross margins and technical content. It’s also promoting a new brand, Eco Surecare, to attract new consumers in lower price segments.
Implications for brands
Given the shopping and pricing trends described earlier, brands should carefully assess their “where to play” options and the price segments they want to compete in (e.g., premium, mainstream, mass). The Elements of Value framework is a great tool for this assessment. Brands should also leverage the latest technology available, especially AI, to create an edge with differentiated insights generated from innovations.
Brands also need to answer several “how to win” questions:
- How to innovate to win? Consumer and channel-centric product innovations are imperative to grow and hold on to market share. Consumer demands and lifestyle trends are constantly changing, requiring brands to be agile and continually adapt their offerings to meet new needs and opportunities.
- How to invest in winning channels? Channels are polarizing into clear winners and losers, and consumer journeys are evolving. In response, brands should identify key touchpoints that affect shopping decisions and determine how to enhance accessibility in targeted channels.
- How to strengthen brand equity and consumer engagement? Brand positioning and consumer engagement should consistently reinforce the brands’ differentiated elements of value. Brands also need to connect with targeted consumers through relevant touchpoints and occasions.
- How to develop and sustain a winning operating model? Brands may need to adapt their operating model to meet new price and cost requirements. This could be achieved through partnership with local companies with cost advantages or greater agility.
There are many opportunities to grow in China’s FMCG market, even though deflationary trends persist and consumer confidence remains lukewarm. Brands will need discipline and focus to navigate this challenging, albeit improving, time.
This report is a joint effort between Bain & Company and Worldpanel. The authors extend gratitude to all who contributed, especially Iris Cheng, Simon Chen, Ivan Zhang, Angela Li, and Emily Zhang from Bain, as well as Tina Qin, Sallian He, Lily Huang, and David Gao from Worldpanel.

Worldpanel—Decoding shopper behavior to shape your brand future
Worldpanel provides brands and retailers with a unique, 360-degree understanding of consumer behaviour across the globe. We are shopper-centric, continuously monitoring the purchase and usage behaviour through the largest omnipanel in the world to shape the brands of tomorrow by better understanding people everywhere. With unparalleled datasets, pioneering technology and expert analysts, we partner with brands and retailers of all sizes, empowering them to reimagine what’s possible, and change the landscape to create a better, healthier, more sustainable and inclusive world. In the China market, Worldpanel is one of the services in CTR, covering over 100 FMCG categories, 50,000+ brands, and 100+ retailers, among many others. www.kantarworldpanel.com/cn-en
Notes
- The scope of the FMCG market in this report doesn’t include 12 new categories Worldpanel started tracking in 2022; therefore, there may be some data discrepancies between this report and other publications. Worldpanel excluded cigarettes from total FMCG data in 2017 and adjusted the online channel weight factor upper threshold for paper products to better reflect market realities in 2020. Worldpanel also excluded toothbrushes and fabric softener from its FMCG totals in 2024. Skincare and makeup data are collected from the Worldpanel beauty panel, covering consumers aged 15–64 in Tier 1–5 cities. Infant formula and diaper data are collected from the Worldpanel baby panel, covering households with babies 0–36 months old in Tier 1–5 cities. All ASPs are calculated based on RMB per kg/L, except for diapers, which are calculated based on RMB per piece; skincare and makeup, which are calculated based on RMB per pack; and toilet and facial tissue, which are calculated based on RMB per 100 sheets/rolls.
- The 27 categories were (a) packaged food: nutrition supplements, biscuits, chocolate, instant noodles, candy, chewing gum, and infant formula; (b) beverage: milk, yogurt, juice, beer, ready-to-drink tea, instant coffee, carbonated soft drinks, and packaged water; (c) personal care: skincare, shampoo, personal wash, toothpaste, makeup, hair conditioner, diaper, and sanitary pads; (d) home care: toilet tissue (the scope of toilet tissue is limited to toilet tissue rolls), fabric detergent, facial tissue, and kitchen cleaner.